I noticed during my runs that the pace recorded by Athletica was incorrect, and as a result, the coach’s summary was wrong.
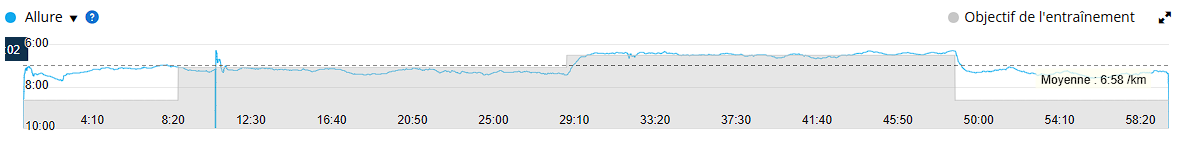
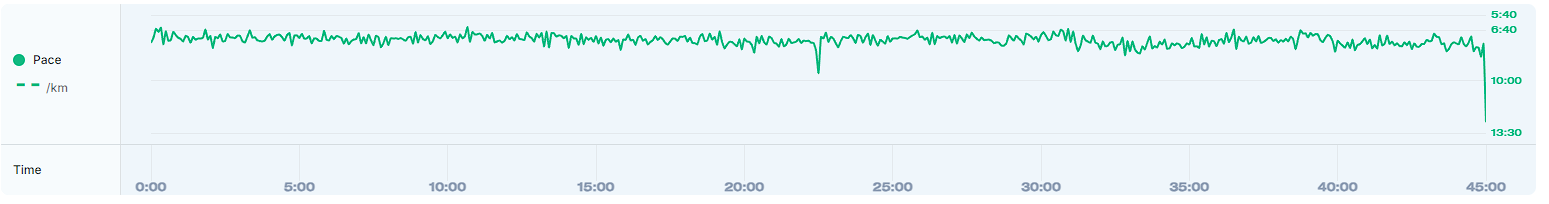
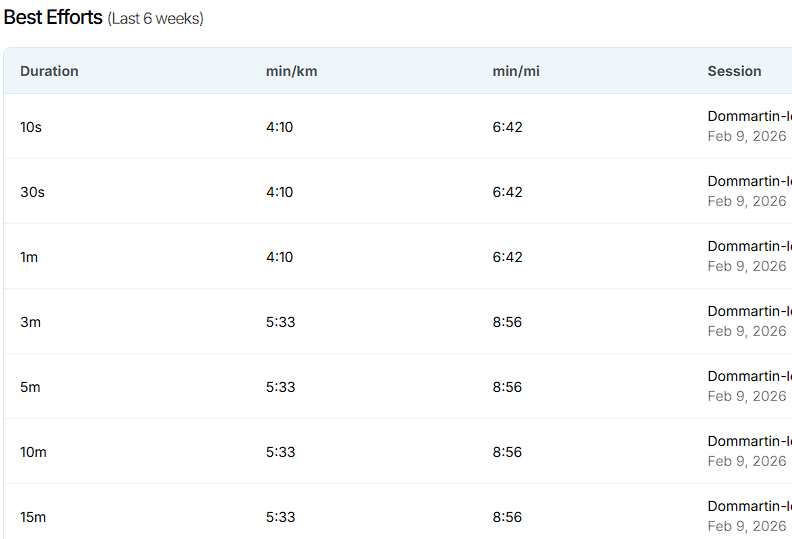
For example, today I did a 20-minute tempo run, and I strictly maintained the pace for the entire 20 minutes (around 6:30/km). Garmin shows that I never exceeded 6:00/km (which is also how I felt) :
The same thing happens to me. In a series of 5,000 meters, my fastest pace was 4:16 and my slowest was 4:44 on Garmin, but the Athletica IA platform shows me completely unrealistic times of 3:55 and 5:14.
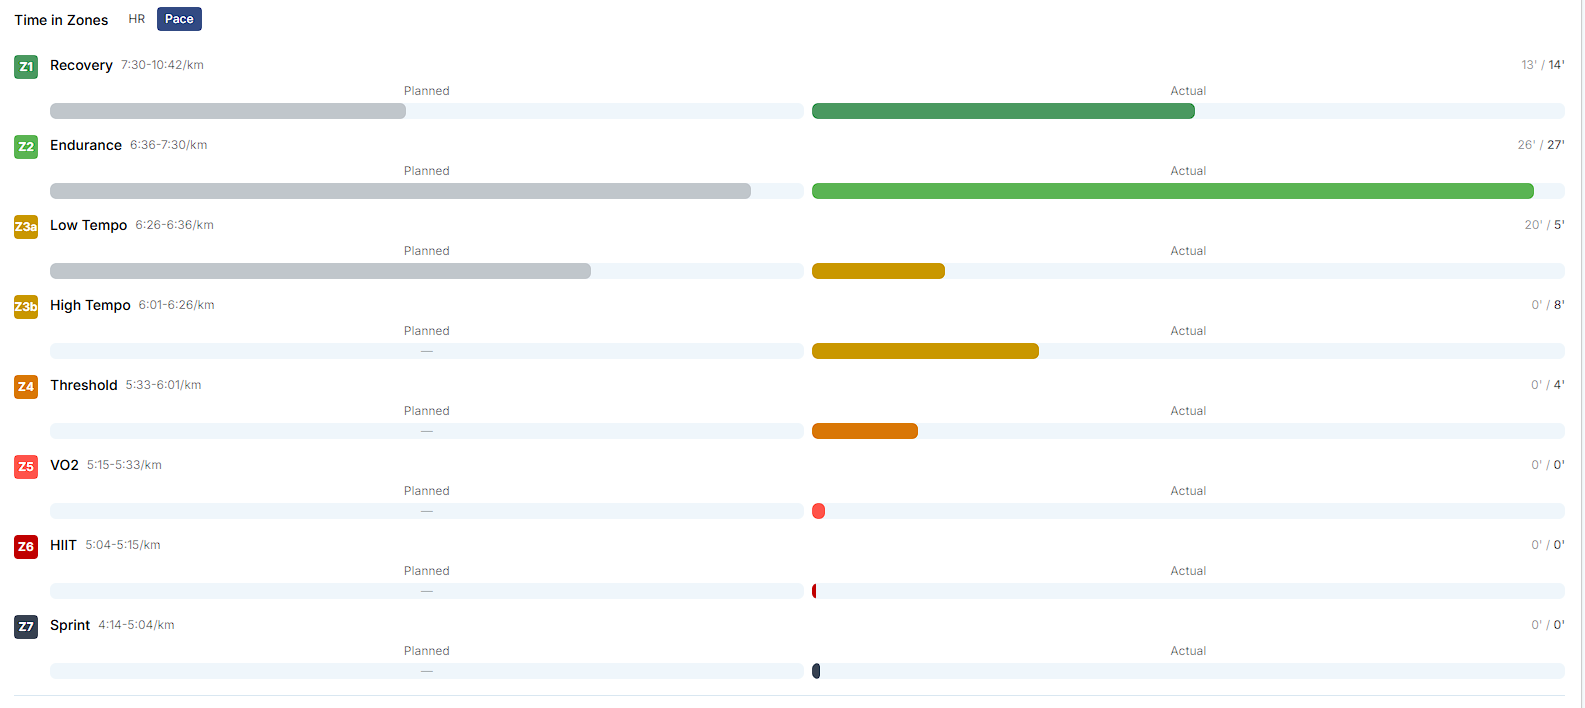
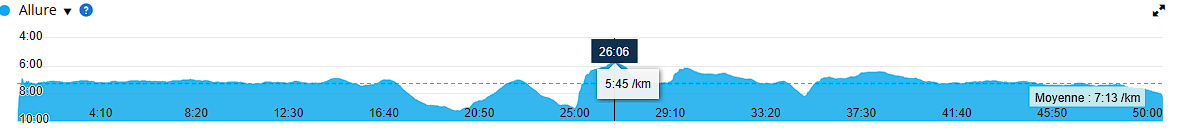
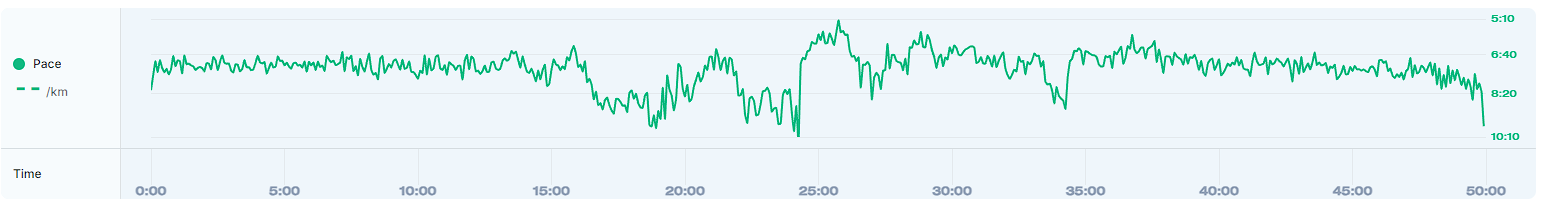
During the uphill strength session, I pick up speed a little on the downhill, I’d say up to ~5:30/km. Athletica tells me that I spent 2 MINUTES between 5:00/km and 4:15/km. Even on the Athletica speed graph, you can see that I never exceed 5:10/km. It’s totally crazy.
Hello @dafft@mateotito This isn’t a “bug” in the sense of wrong data being created, but it is a known issue with how we currently parse .fit files. Garmin (and some other platforms) applies smoothing/filters so brief speed spikes don’t show up as sharply in their graphs. Those spikes can still exist in the raw data- you just don’t see them as clearly because they’ve been processed out.
Right now, we’re displaying the raw signal more directly, which can make these short spikes look exaggerated (like in your examples). We agree it’s not ideal for readability, and we’re actively working on improving the parsing + smoothing so the graphs are more consistent and intuitive.
One helpful lens in the meantime: if it’s ~4 minutes inside a 45–58 minute session, that’s roughly 6–8% of the workout. Still annoying (totally fair), but it doesn’t mean the whole session is “totally crazy” - it’s a brief raw-data artifact showing up more loudly than it should. When it comes to your profile data, the short duration skew doesn’t affect your overall load in any meaningful way.
Appreciate you calling it out: it’s on our fix list.
Smart watches use GPS, gyroscopes and accelerometers to detect motion. That signal is never perfectly smooth.
Tiny pace spikes happen because motion sensors are affected by:
Arm swing and cadence changes
Trees, buildings, or turns
Small moment-to-moment position errors
So the raw pace signal always contains brief jumps , even when your effort is steady. Watch brands then apply strong smoothing using those motion sensors to hide these spikes in the display. It is the way different companies handle the signal. Makes sense?
I mean, if Athletica sees that I’m not spending enough time in certain zones, he’ll adjust my training, even though I followed the instructions, right?
(And if that’s not the case, I don’t understand why he wouldn’t adapt my future workouts based on my past workouts either)
Is it possible to get a response from the Athletica team, please? I understand the “raw signal,” but what I don’t understand is how Athletica can function properly with incorrect data
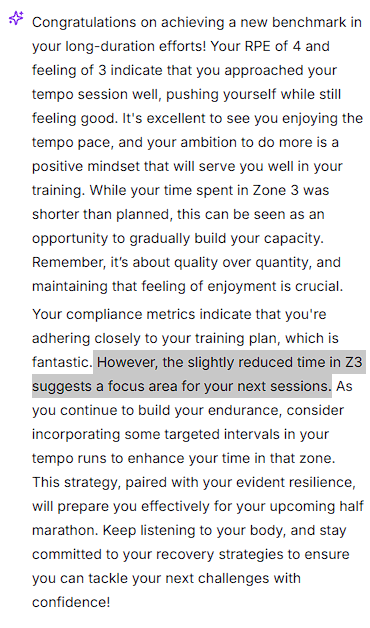
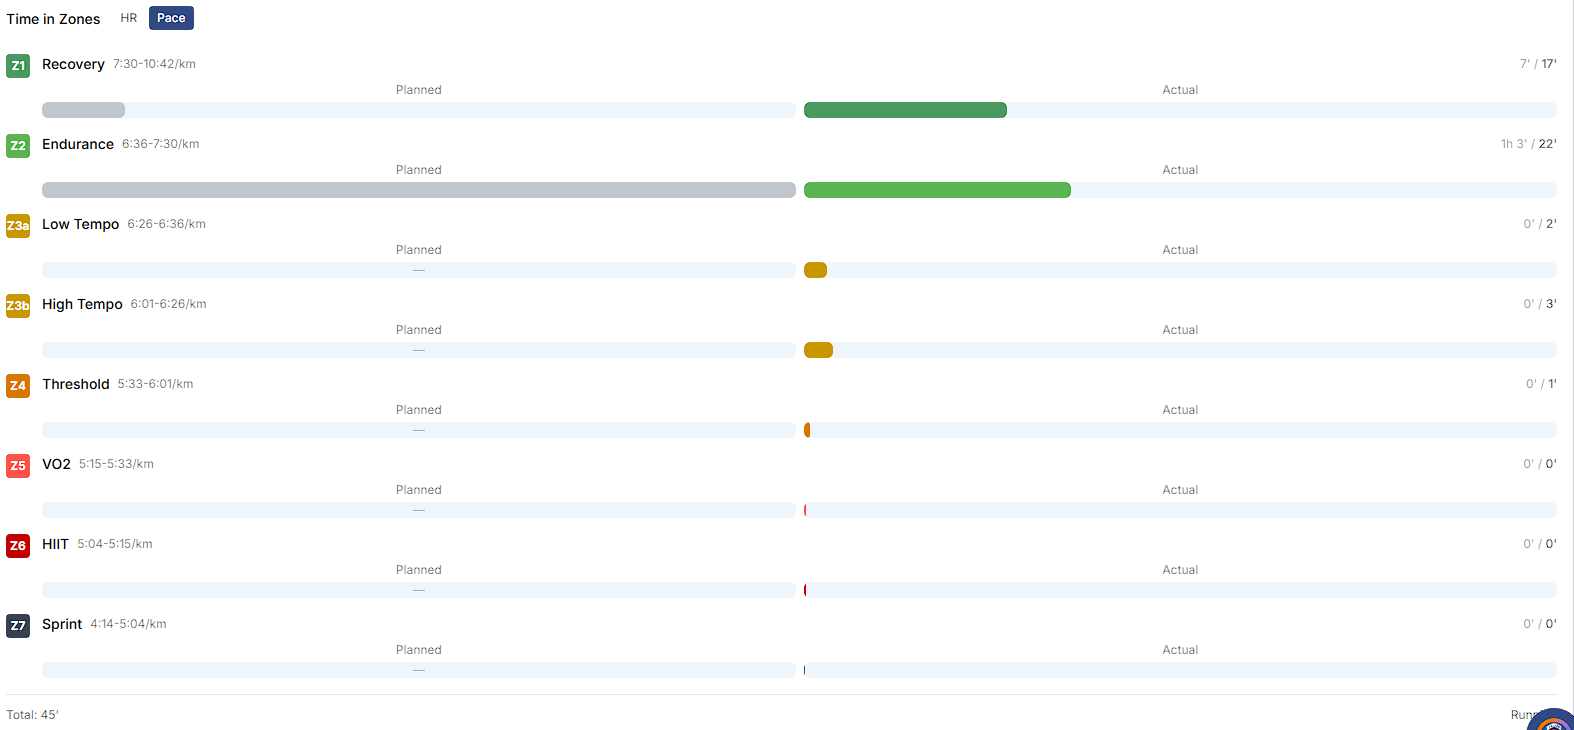
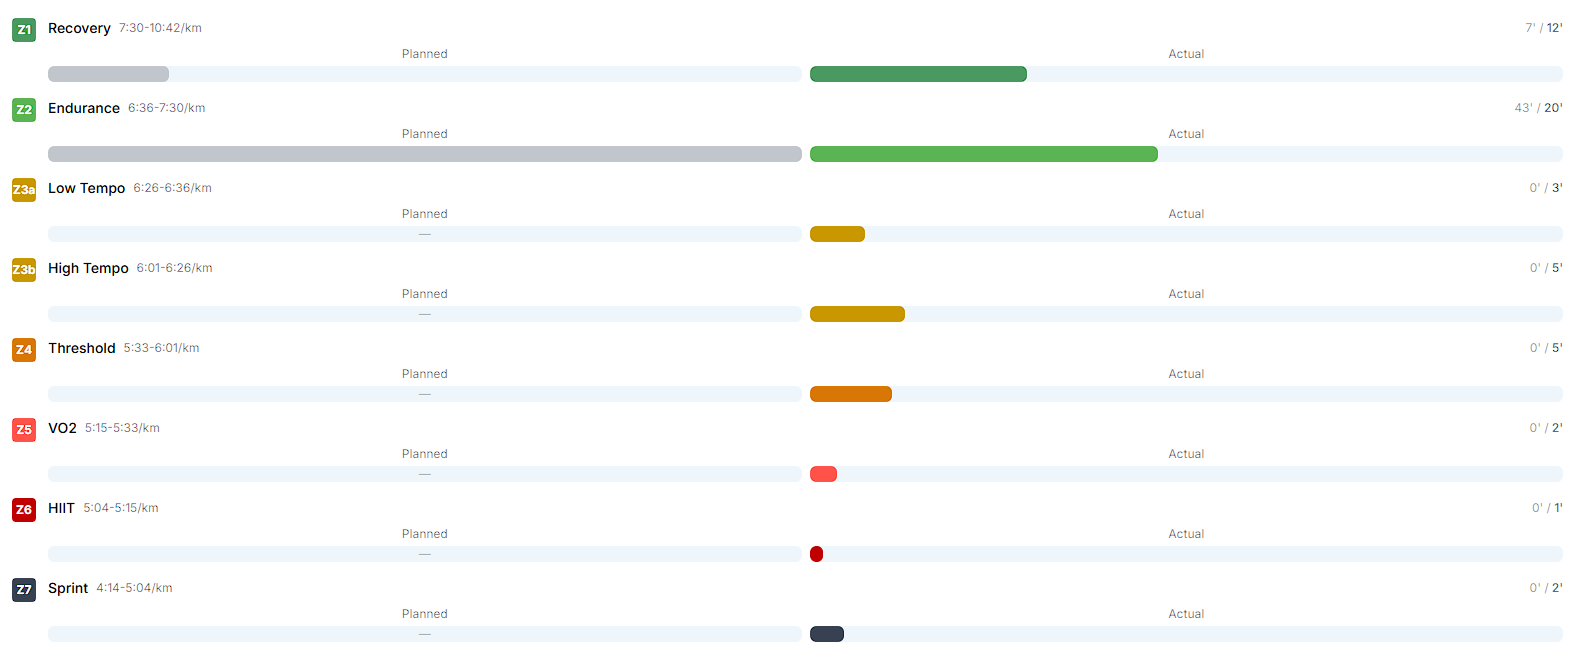
I appreciate your efforts to fix this. I am not sure up to which point this bug affects planning but it’s indeed recognized and pointed out by the ai coach on his answers to the run debrief. In my z3 tempo run today I am pretty sure I didn’t spend a single second on zone 7 but ai coach said:
“Your recent tempo run showcased impressive speed zone compliance, especially in Z1-Z2 and Z7, indicating a solid aerobic foundation. While the time spent in Z3 was shorter than planned, your RPE of 5/10 and a feeling of 3/5 suggest you effectively managed the intensity despite the wind.”
Of course, my question wasn’t whether they’re working on the problem—because I’m sure they are—but rather how much this might affect our training program