Hi
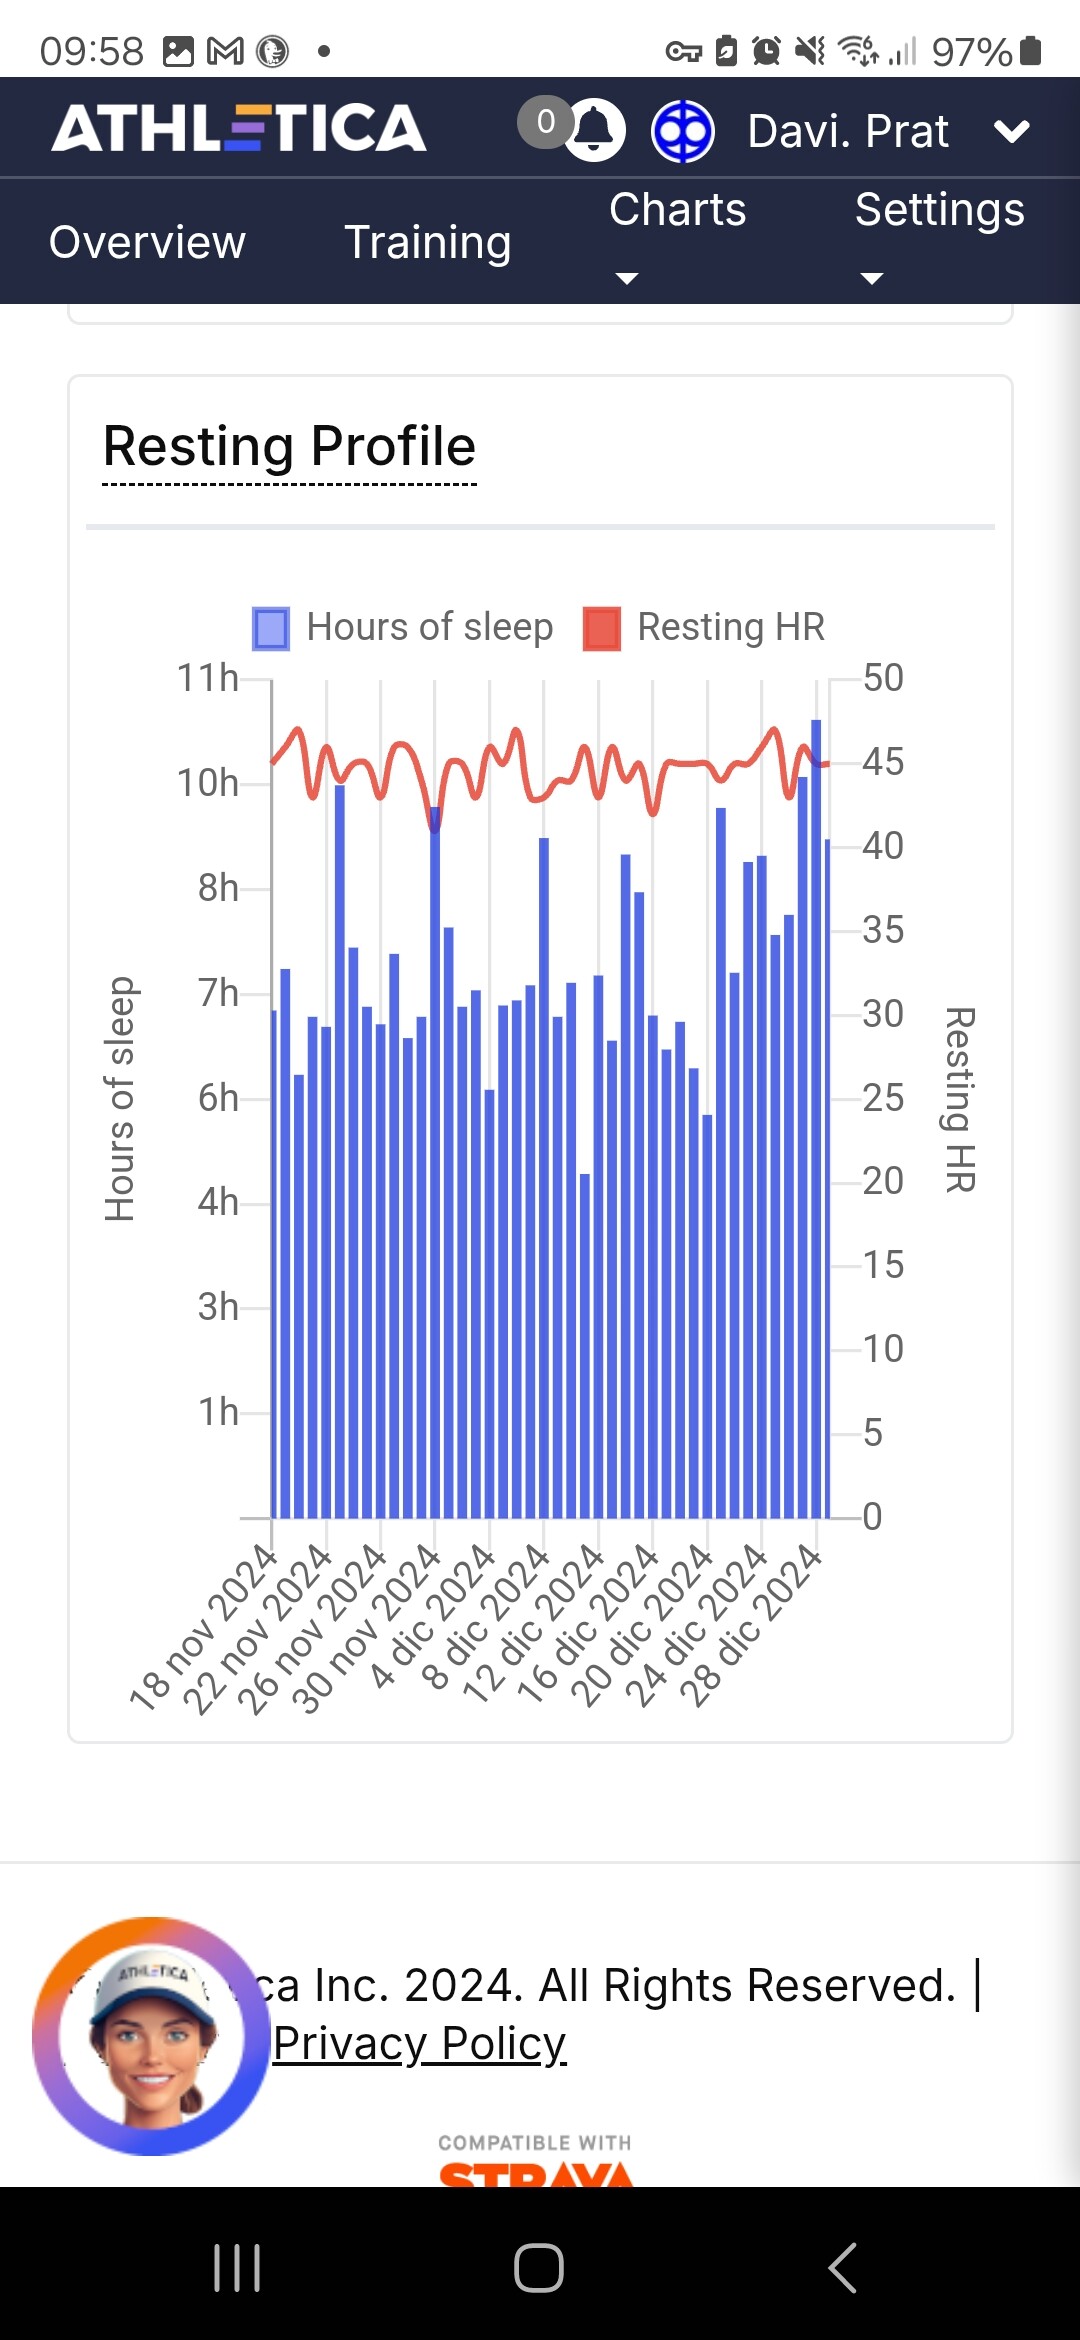
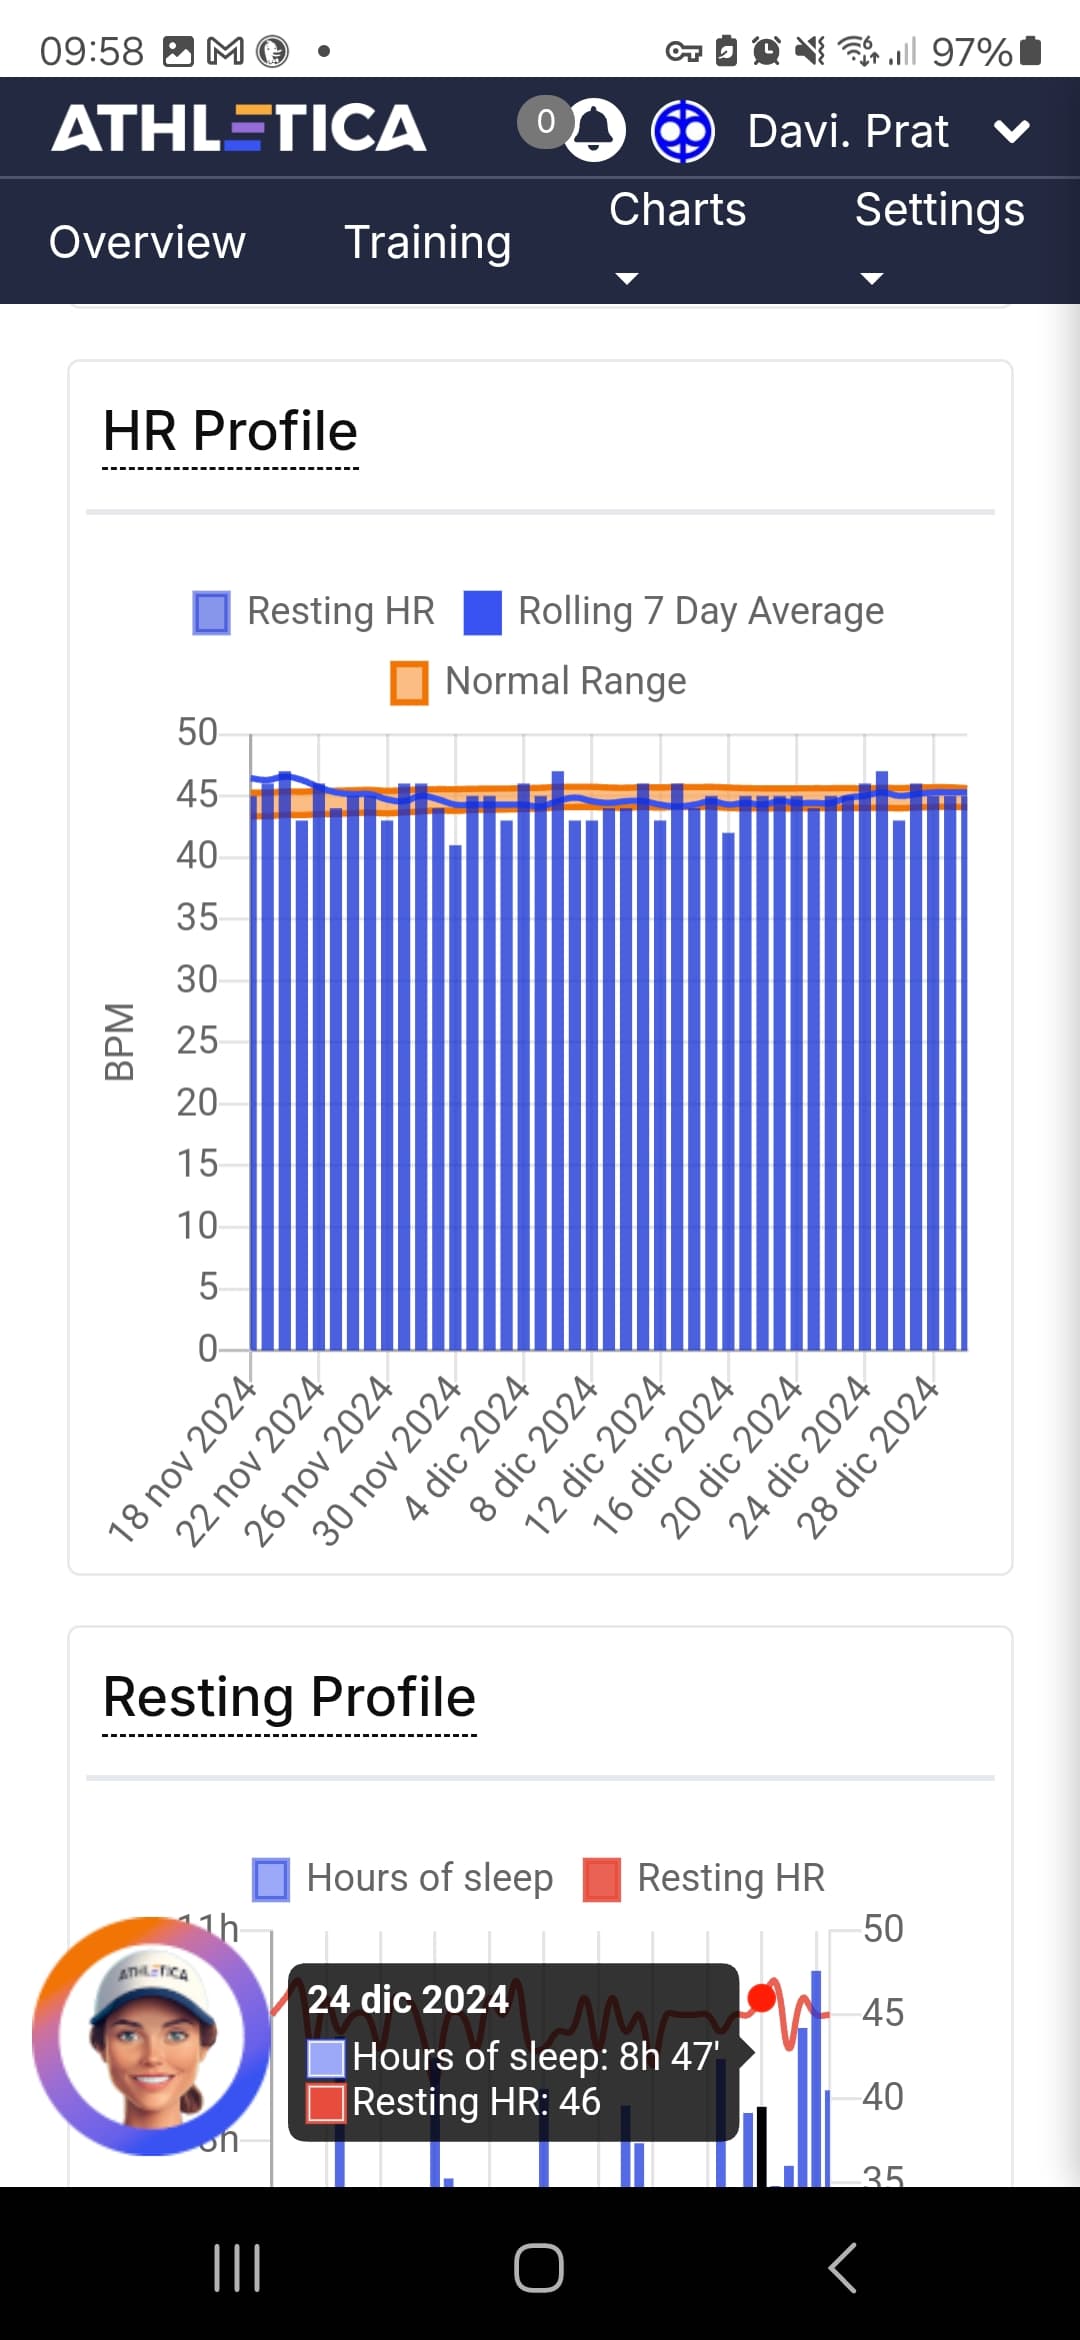
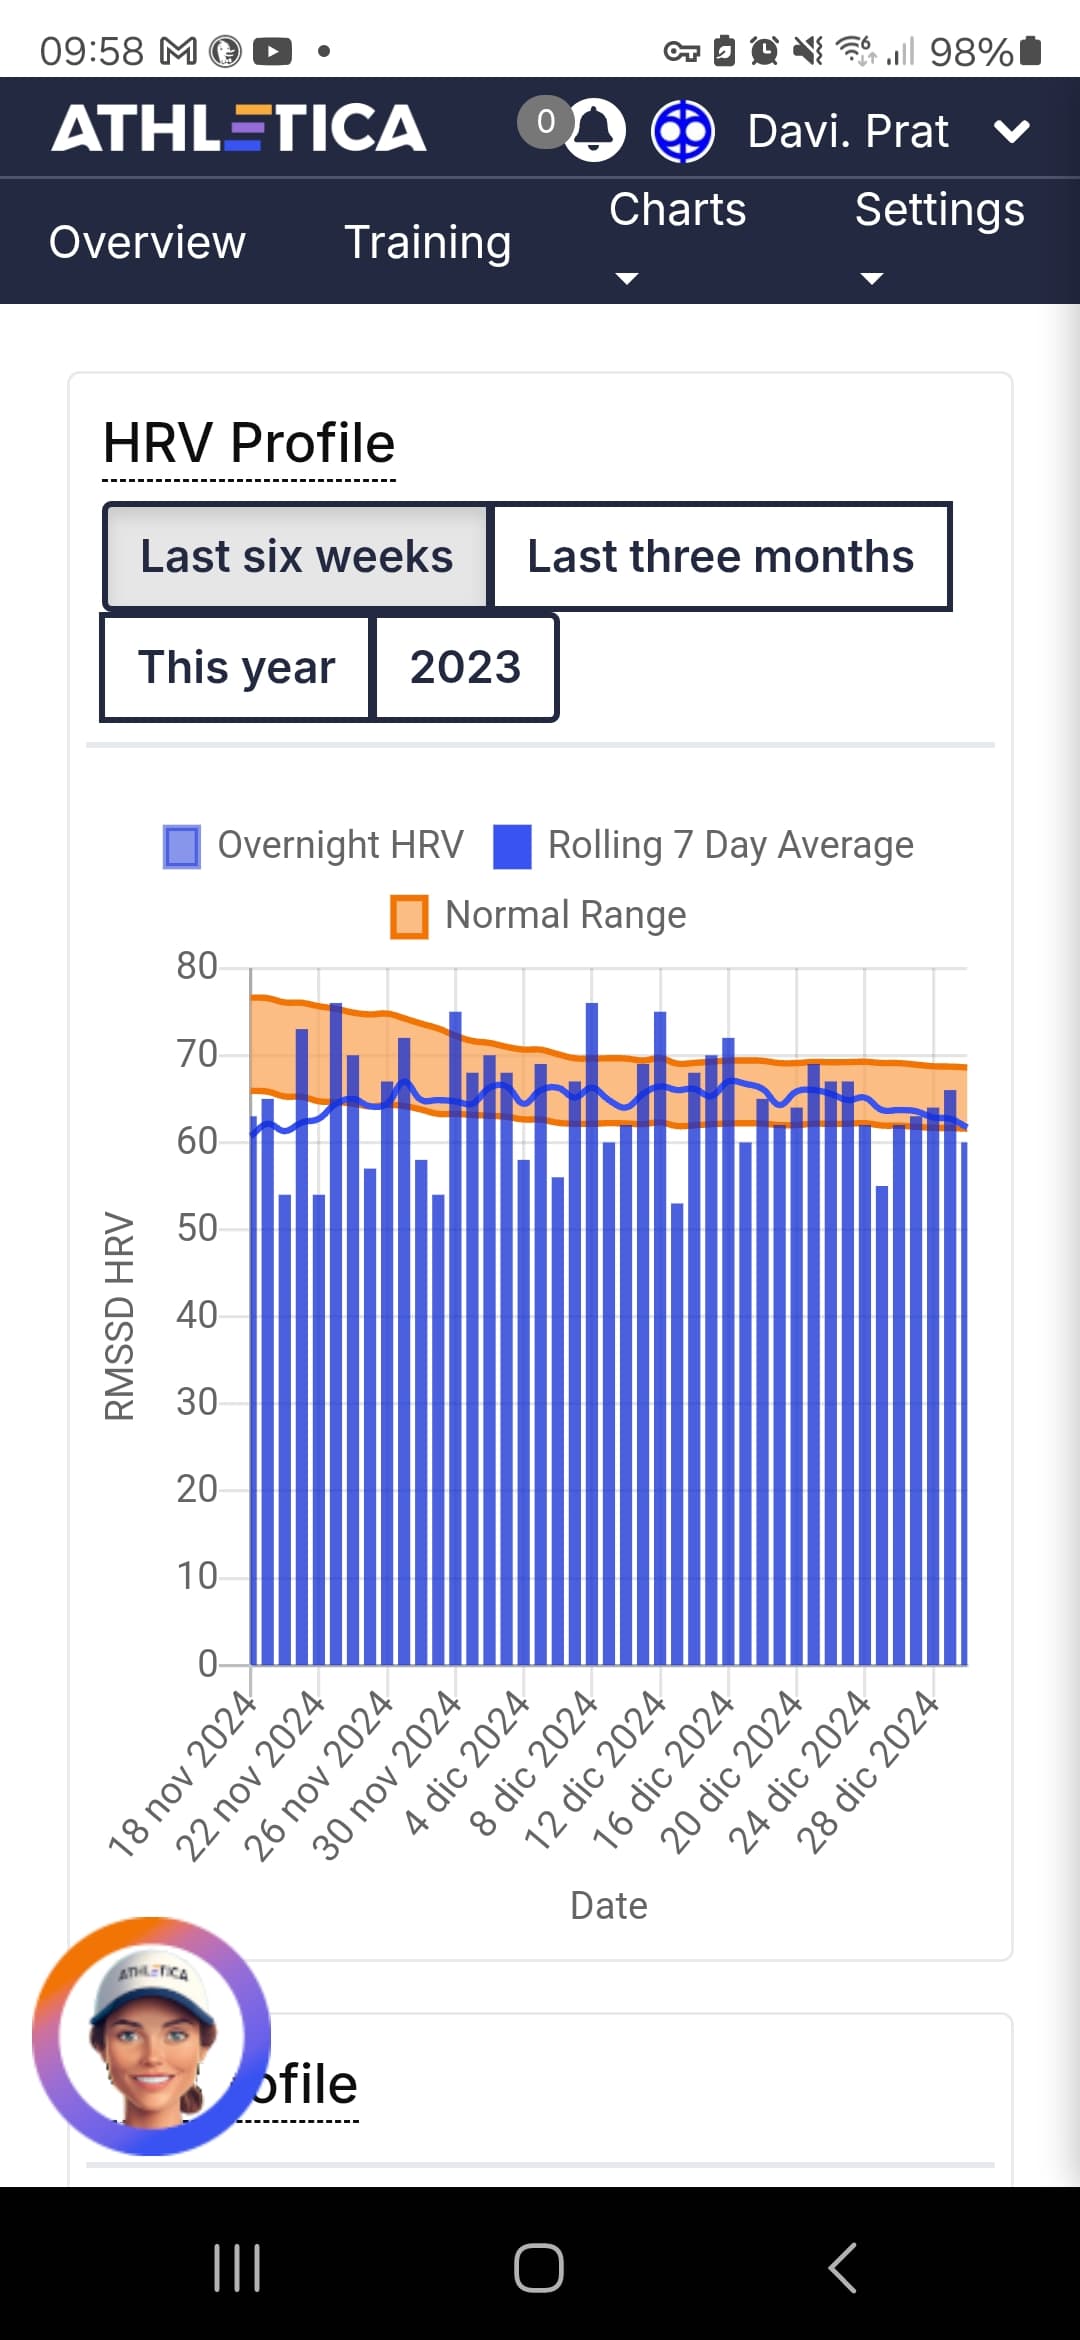
Do you think it could be helpfully if we scale a little bit graphs of recovery? As you see in the pictures, mine is a little bit compressed. I think that if we start y axe at 20 25 bpm, 30 35 HRV and 2 3 hours of sleep, they will be more readable. Or maybe they will be automatic scalable depending on the values to report
9 Likes
That’s exactly what I wanted to share.

I think the y-axis needs auto-scaling to make maximal use of the space for valuable information. This may lead to more dramatic depictions, but it would help a lot with readability.
4 Likes
thanks @Prato & @Harlerunner … dev ticket added for this.
2 Likes
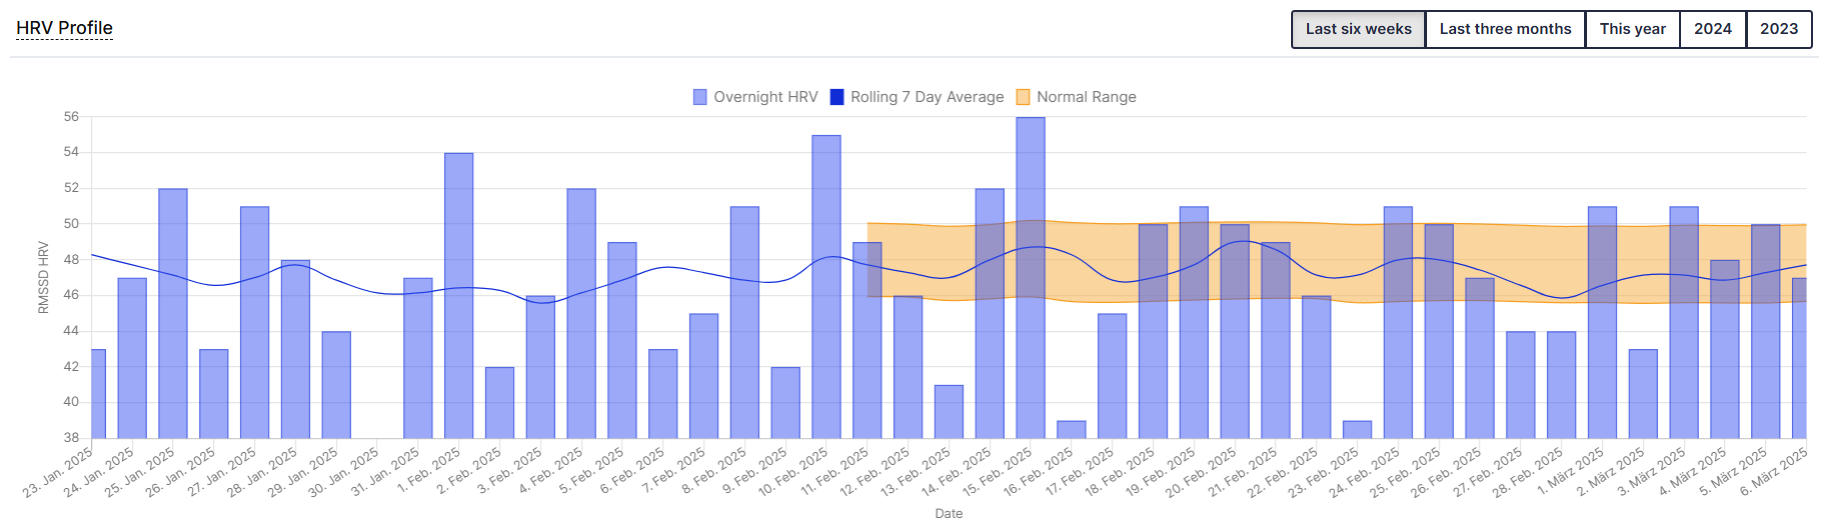
@Prato @Harlerunner please logout and back in again and check these graphs for us when you get a sec please.
Along this same line of thinking - It might be nice to have a little more control adjusting the time scale of these, giving certain quick hit buttons (1mo, 3 mo, 6mo, 1 yr) but also a field for custom ranges?
1 Like
Hi @Prof
Yes now is more more more readable!!! Thank you
1 Like