I thought I’d post about the new Connect IQ WR Time to Zero feature, introduced in December.
Workout Reserve in real time is now more than a year old, but it has continued to evolve. One question @Prof , @Andrea and I asked ourselves a year ago, is whether it was possible to predict in real time when Workout Reserve would reach zero. In effect a personal best in the Athletes power profile. It’s not an easy question to answer, as workout reserve does not behave in a linear manner.
Here’s a graph I produced showing the underlying maths in workout reserve. This is for a steady state / pace run / ride. It takes on all sorts of beautiful shapes once we have variable paced efforts.
Through intuition and pen and paper I came up with the maths to predict the time to zero. The maths is precise, but no one runs at a perfect pace or rides at a perfectly smooth power. Thus we have to balance reactivity with stability. That means doing calculations across an Athlete’s entire WR profile, making multiple predictions for time to zero. A 10 second profile will be highly reactive to recent changes in pace or power, but will introduce greater uncertainty in the predication. a two hour profile will be slow to react to recent changes in pace or power, but will give a more stable prediction. The former can be used to make predictions early on, the longer the duration the more we can use longer parts of the profile to yield more stable predictions.
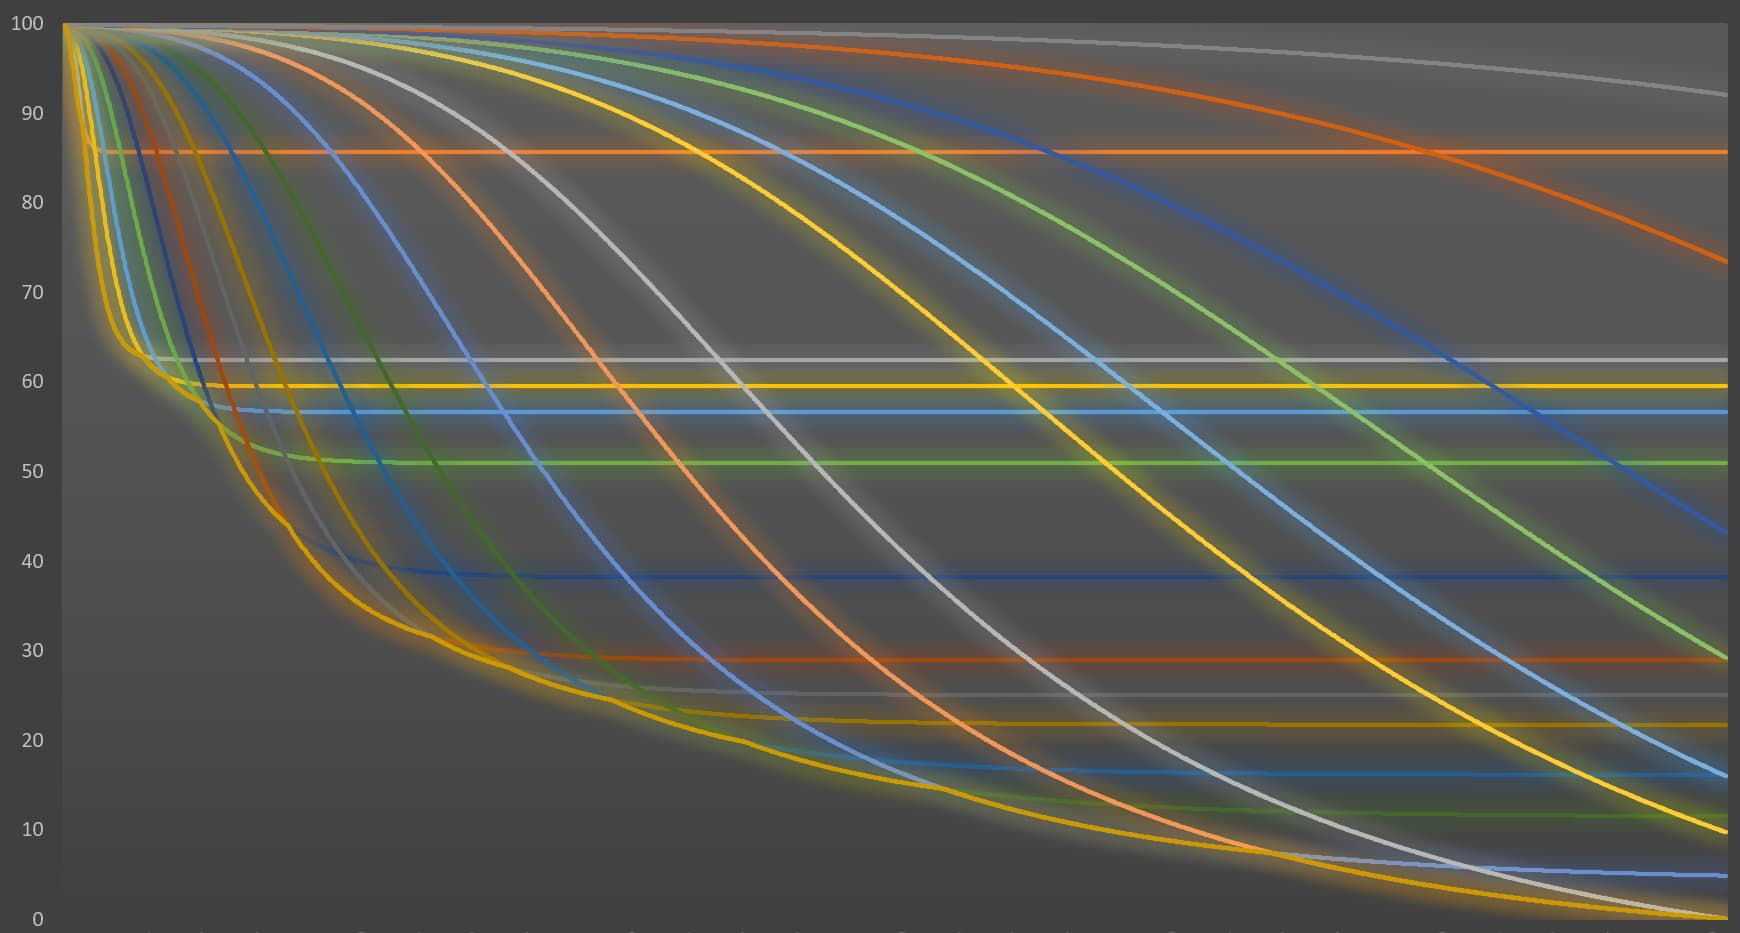
Here’s an example for a runner, who’s personal best for the Marathon is 3.5 hours. Thus equates to 12,600 seconds. Here is what Time to Zero will predict if they ran 3.5 hour pace, with pace being a bit above or below at times but no more than 10%.
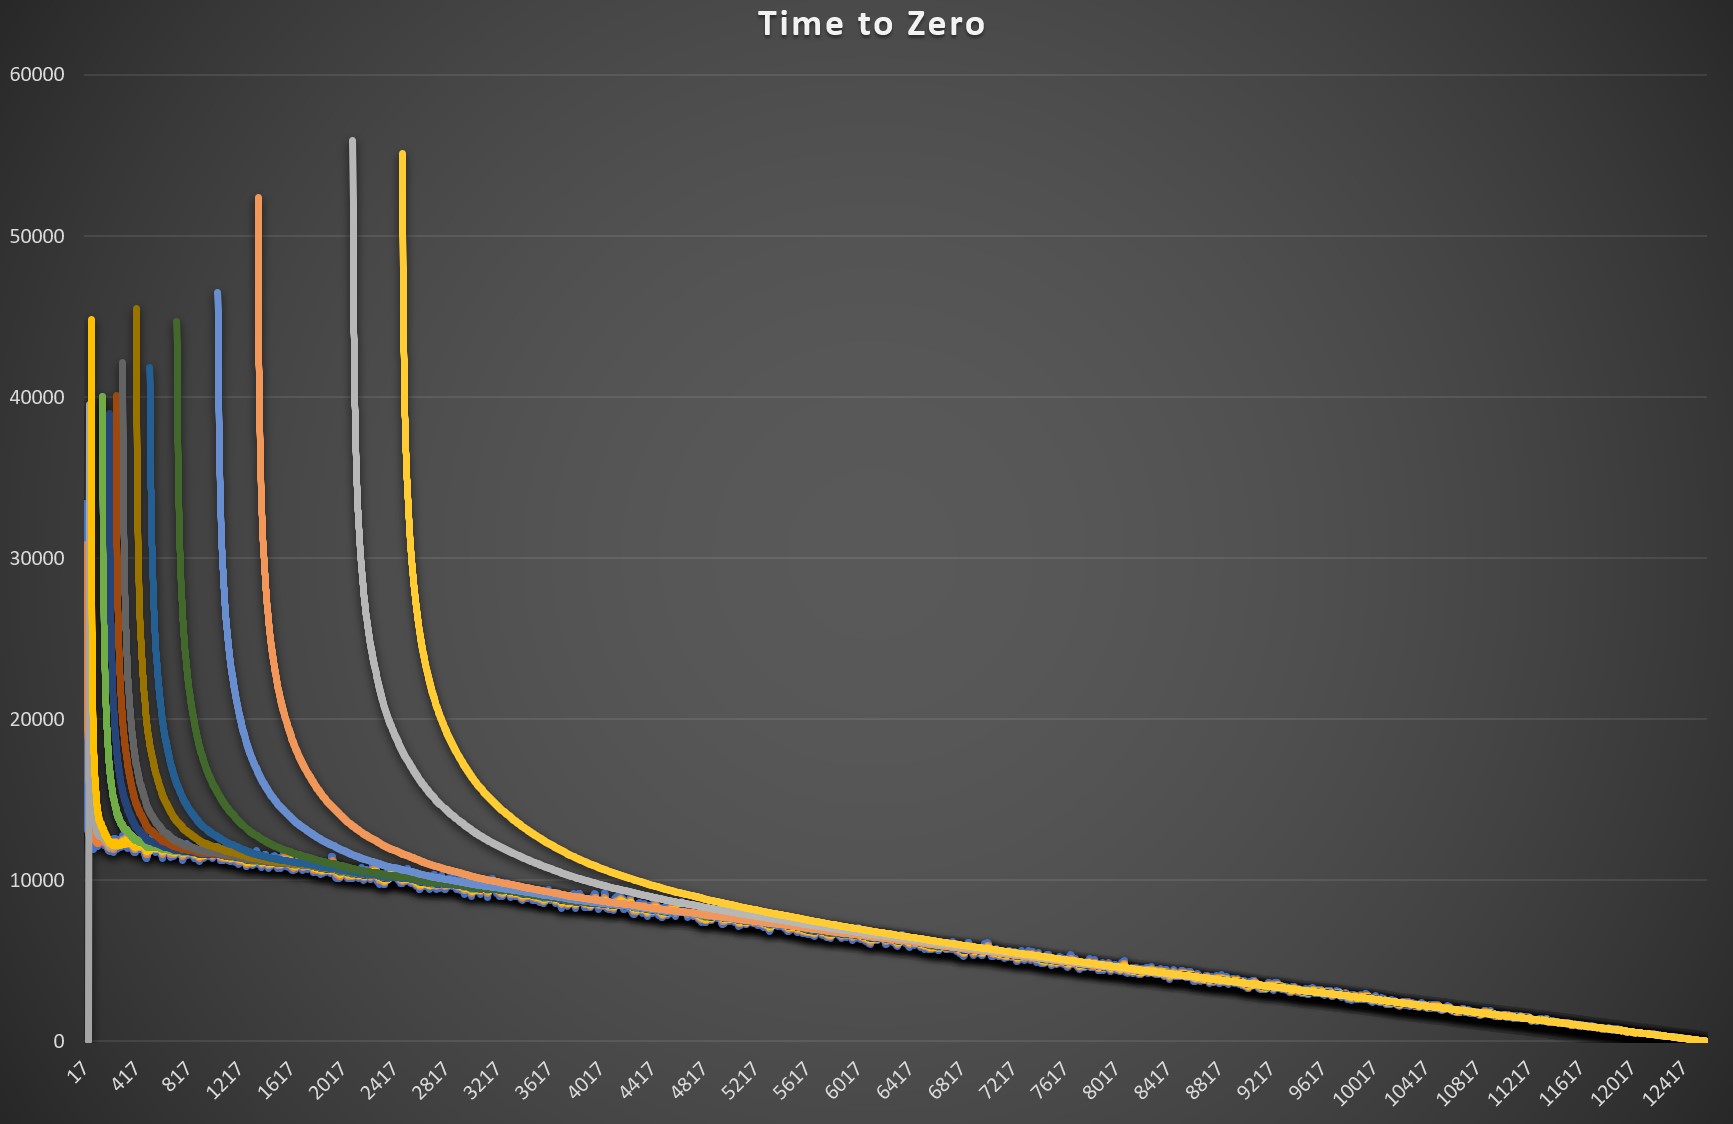
TTZ is the almost straight line, intercepting the X axis at 12,600 spot on. The lines coming down are the different predictions from all the different parts of the WR profile. You can see that they eventually converge on the same answer for what is a steady pace.
To see this a bit clearer I can normalise the predictions, by the time at which they are made during the marathon. For clarity I haven’t shown the outputs of the calculations for every duration in an athlete’s profile. You can see the predictions are converging on a 12,600 second or 3.5 hour marathon time. The point at which they match their PB crossing the line.
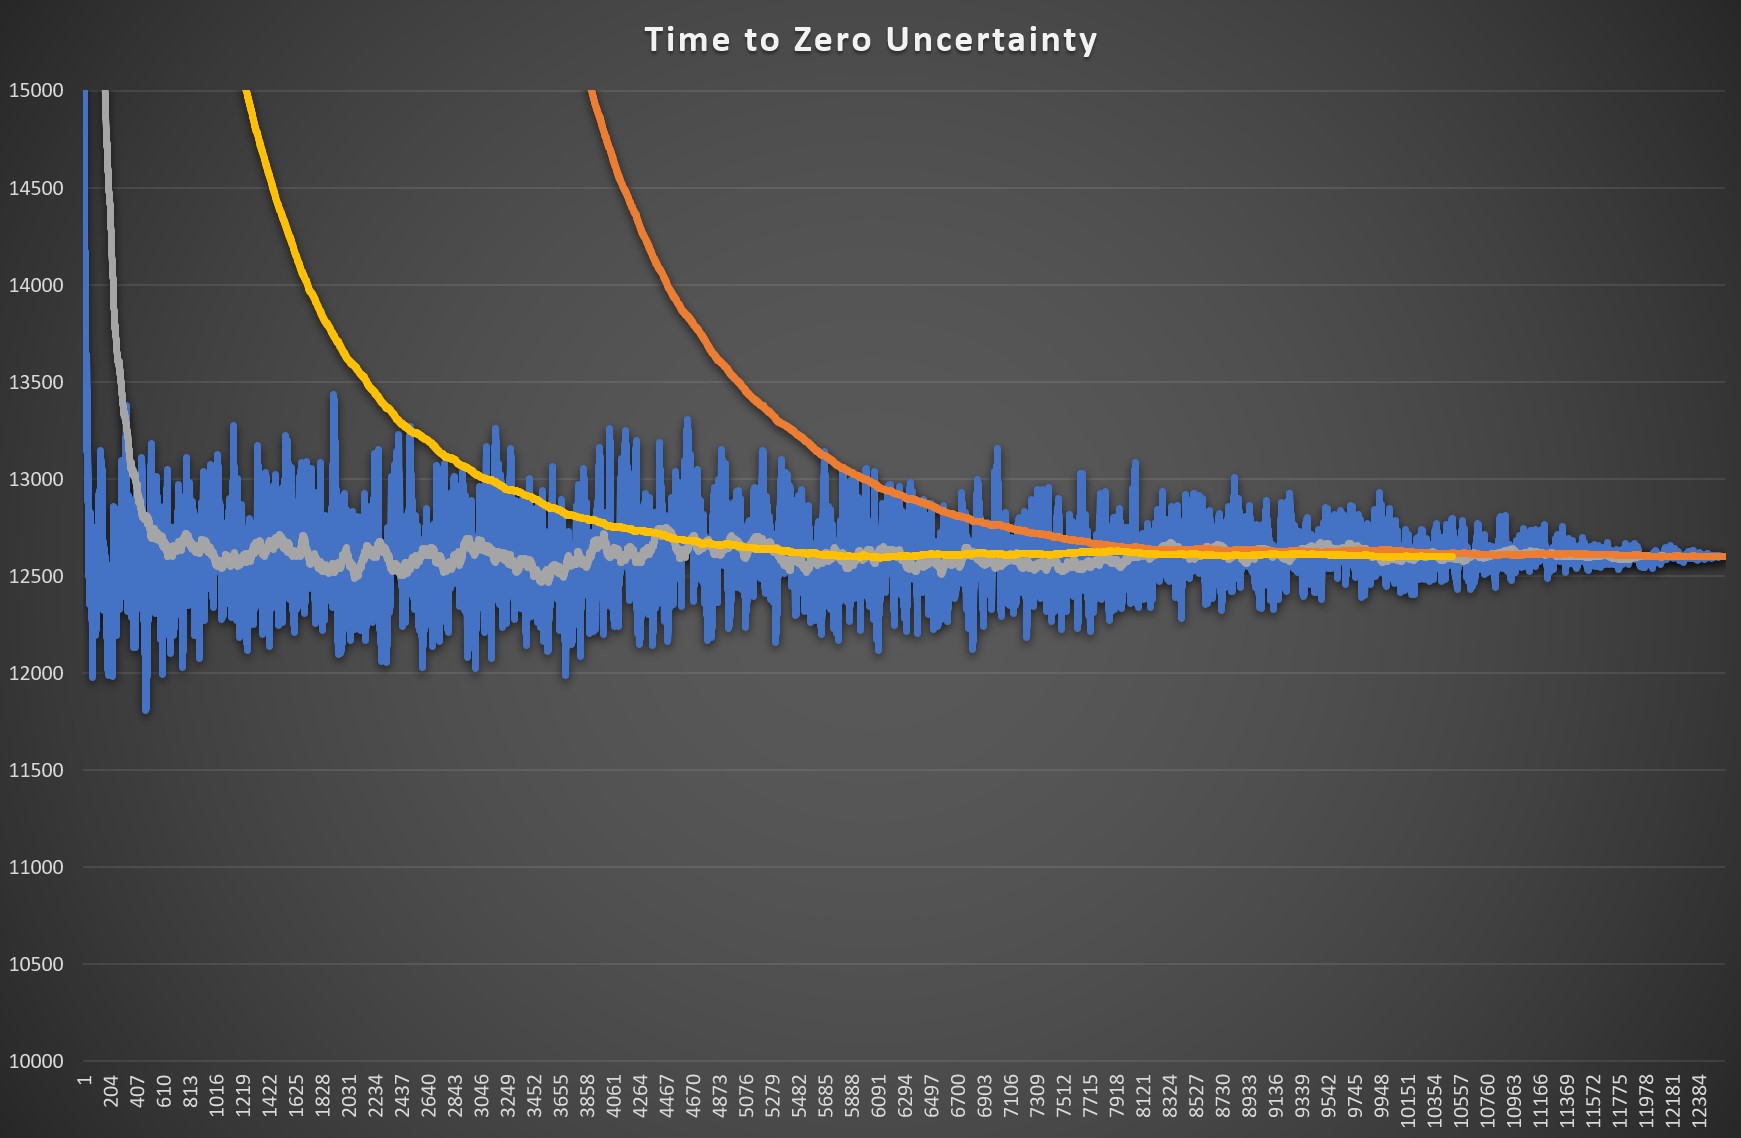
What you can see is the forecast from 10 second pace (in blue) generates a wildly fluctuating predication. The 10% up and down in the pace, magnifies the uncertainty, which is not linear. So it can make predictions but they fluctuate a lot. In grey we have a prediction made using the athletes 2.5 minute profile, less uncertainty. As time goes on, we are able to make predictions using successfully longer durations in the athlete’s profile. Yellow is their 30 min profile calculations, at first it is wildly out, but eventually settles in a manner with much less uncertainty, and it settles at 3.5 hours prediction. Then the 1 hour profile can come in later, is even less perturbed by the 10% variation in pace, and converges with the 30 min profile prediction. As time goes on uncertainty reduces, as more becomes certain (being in the history now), and slight changes in pace have less effect on overall predicted time.
Hopefully next week, I’ll have a real live FIT file from a marathon to do some analysis on, which can then be used as a further discussion point.
I hope this gives some insight in what Time to Zero is trying to do, and the choices that we have to make between uncertainty with fast reactivity and certainty with slow reactivity. I’m sure there may be some evolution here @Andrea
For now, it’s early days in its use, and I’d use it as a tool with data of interest. Listen to your coach and your plans for pacing any events!
Phil